Free Printable Australian Animals Graphing Activity
I confess, I don’t actually know a lot about Australia. However, my kids love learning about it, so we have gathered up bunches of books on the country and of course, watched Finding Nemo… (East Australian Current, Sydney, that’s educational, right??) Even if you don’t count Finding Nemo in the educational category, you can definitely count this fun Australian animal graphing activity. It’s great for a geography unit about Australia, New Zealand and Oceana or learning about different animals in science. Cross-curricular activites bring learning to a whole new level!
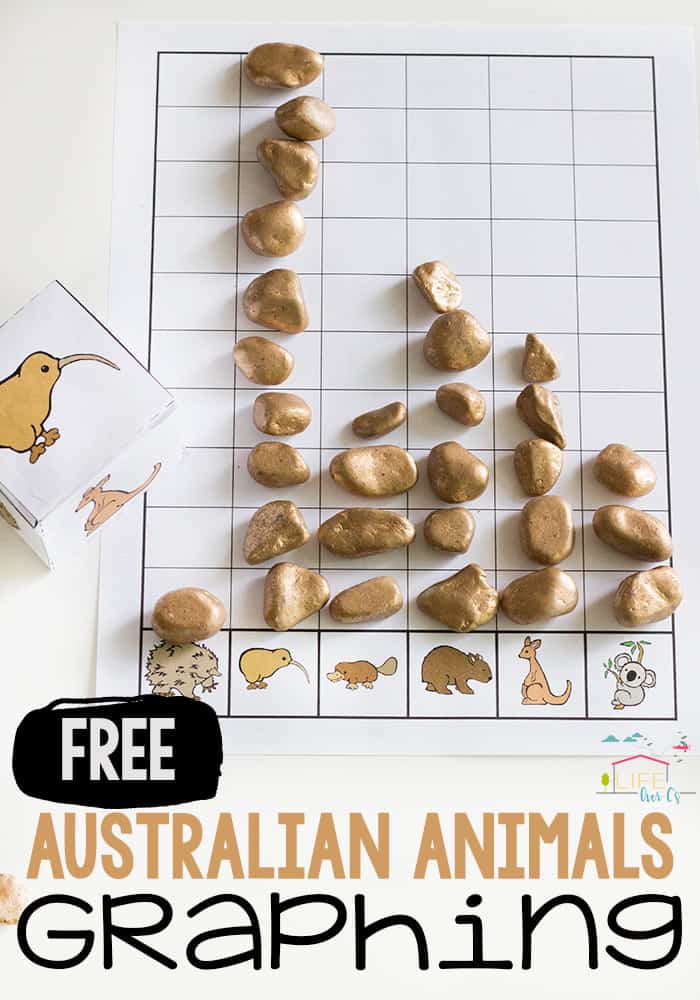
Please note: I have been informed that the Kiwi bird is not from Australia as pictured, but rather New Zealand. I have replaced it with a dingo in the actual file (only the pictures here have not been updated.) To my awesome Aussies, thank you for letting me know and as soon as new clip art becomes available I will make an adjustment.

Recommended Grade Level:
To prep: Print the graph and dice from the download at the end of this post. Then, use scissors to cut out the cube template.
Fold the cube template on the inside lines and tape it into a cube. I find it helpful to put additional tape on the outside of the cube to give the dice a little bit more weight and to last longer.

Then, laminate the graph for durability. If you laminate, you can also use dry erase marker to mark each box as the pictures are rolled.
To use: Simply roll the cube and mark which animal was rolled. There is a small key included to help children learn the names of animals that are unfamiliar to them.
Continue rolling until one column reaches the top.

Then, guide your child in analyzing the data:
Practice counting and count each column.
What animal was rolled the most? The least?
Did any animals get rolled the same amount? Not at all?
Then, you can write down the totals, clear the graph and do it again.
Did you get the same results?
Why do you think you didn’t get the same results?
While this is a simple activity to do, this is the beginning stages of understanding probability, so it’s an important skill. Plus, my daughter just LOVES tossing the dice…

join the newsletter & Get your free activity
Get Your Free Printable Activity Here!
Already a subscriber? No worries. Just enter your email here to have the activity sent directly to your inbox.
More Graphing Activities You’ll Love:
Animal Activities to Try:
- Forest Animal Pattern Block Mats
- Rainforest Animal BINGO
- Farm Animal Hide & Seek Game
- Zoo Animal Pattern Block Mats
- Arctic Animals Posters & I Spy
Search All Activities
Looking for more? Find exactly what you need here:


I was so excited to see this on your files, knowing how great your other printable are. Can I be picky, as the kiwi is not an Australian animal and is not found in Australia. The kiwi is from New Zealand. Perhaps it could change to a possum, emu, kookaburra or crocodile as a substitute? Sorry to be critical, but i think it would otherwise be a fantastic activity.
Hi Suzie! Thanks for the information. I got the clip art from an Australian clip art designer, so perhaps it’s better to think of this activity as an Oceana Animals activity rather than exclusive to Australia. 🙂