Fun, Hands-On Car Graphing Activity with Bubble Wrap
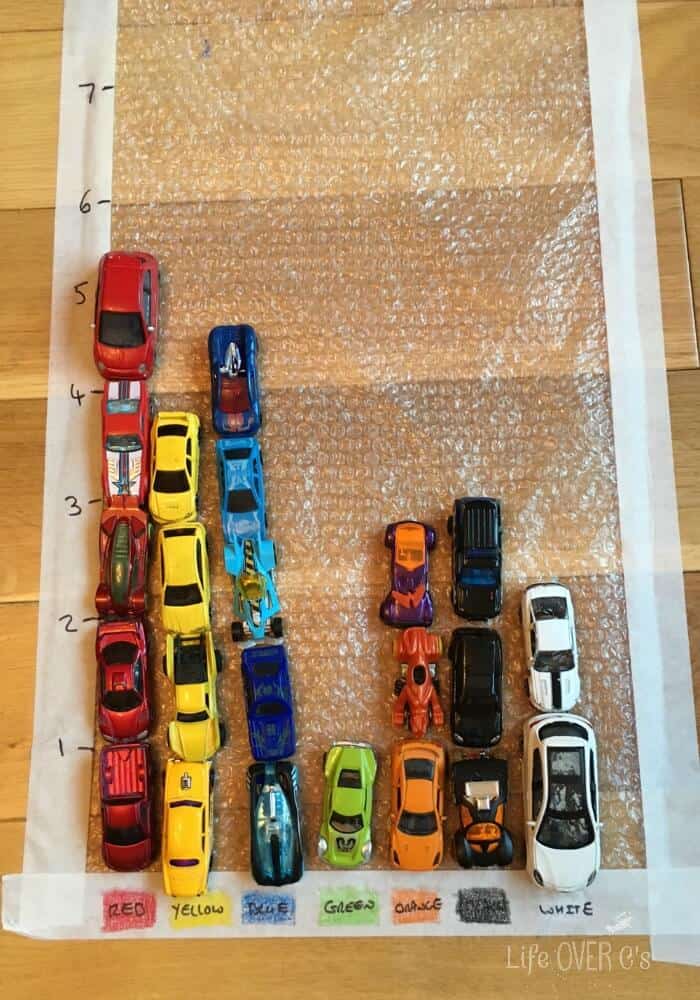
Setting up a simple hands-on car graphing activity, using their favorite toys, is a great way to introduce this important math concept to your pre schooler. Cars are big news around here right now, so we gathered ours altogether and set about making a graph on a Bubble Wrap Road, to work on color sorting and comparing less and more.
Recommended Grade Level:
How to set up a Bubble Wrap Road Graph
Tape a large sheet of Bubble Wrap to the floor or a table top would work just as well.
Along the horizontal-axis add the numbers 1-10, use a car to help measure the correct distance between each car.
Along the vertical-axis use crayons or colored stickers to mark out each of the colors that you are going to be measuring.
Park all of your cars up alongside the horizontal axis and get ready to start driving them down the Bubble Wrap Road.
Color Sorting on the Bubble Wrap Road Graph
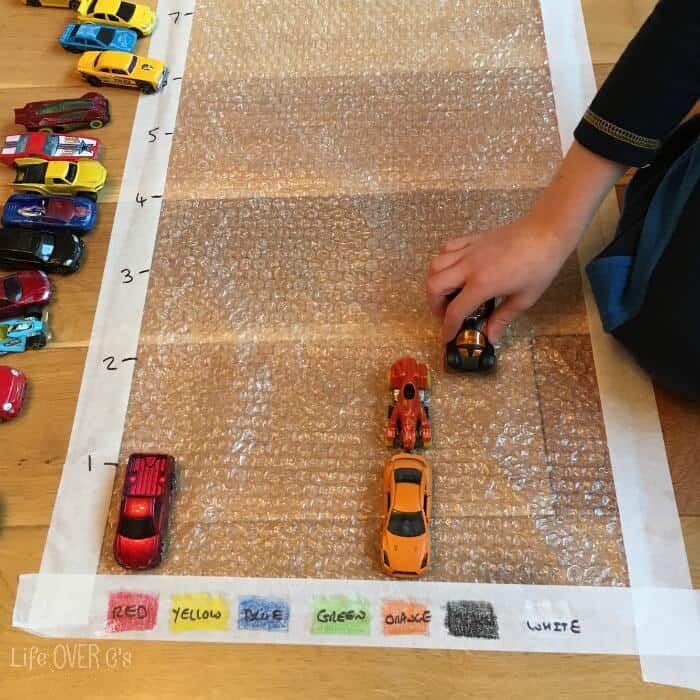
Ask your child to drive each of their cars in turn down the Bubble Wrap Road and park them up in the corresponding colored line.
Work together with them if they are starting to struggle. A few of our cars have several different colors on them, so we did have some debate over which line they should go in. We went the color they had the most of. (This turned out to be a handy way to introduce the final part of the activity.)
Comparing Less Than and More Than using the Graph Results
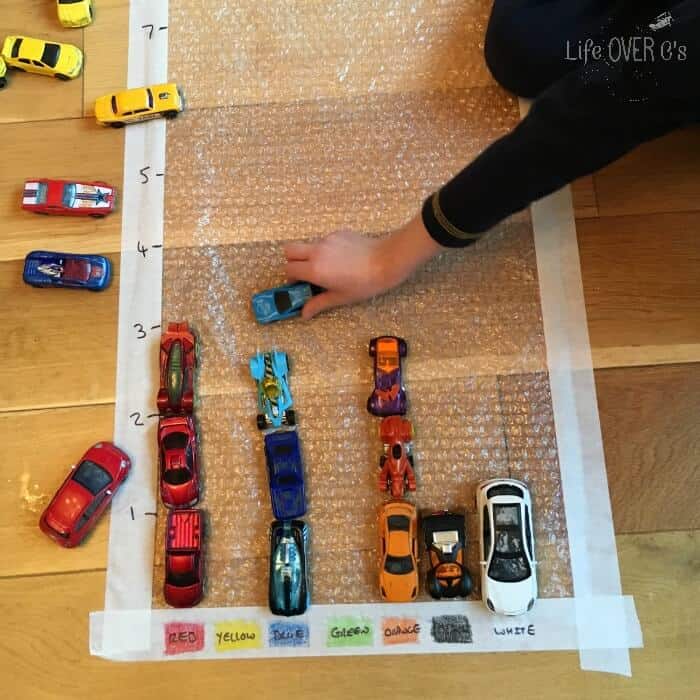
Once we had all of the cars parked up in their correct lines, we could then start to use the different data sets to work on another important math concept, comparing less than and more than.
We began by counting each of the lines to see how many red cars we had and then moved along through each of the colors.
Once we had completed all of the data sets, I asked the following questions:
- Which colored cars do we have the most of?
- Which colored cars do we have the least of?
- Do we have more red or yellow cars?
- Which color car do we have less of white or blue?
More Graphing Activities You’ll Love:
Other Transportation Activities:
Search All Activities
Looking for more? Find exactly what you need here:


